
Stereoplotters
The most important piece of equipment used in map making is of course the stereoplotter. There are two basic types of stereoplotters, projection and optical. While the projection plotter in no longer used we will discuss it because for years it was all we had.
Kern PG-2 analog stereoplotter.
Photo by W. Mayo
Kern PG-3 analog stereoplotter in Aarau, Switzerland.
Photo by W. Mayo
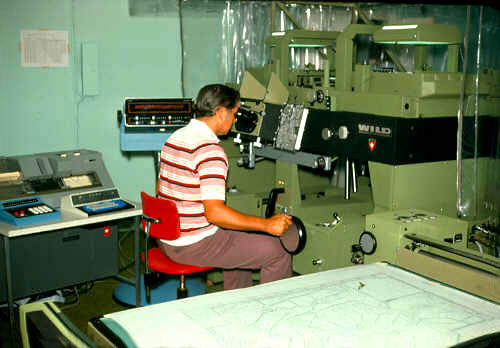
The projection plotter: Diapositives of a stereopair are placed in projectors and illuminated from above. The light rays are projected through the projector lenses and intercepted below on the platen. The function of the viewing system is to enable the operator to view the stereomodel three-dimensionally. The left eye views only the overlap area of the left photo while the right eye sees only the overlap area of the right photo. The anaglyphic system uses red and blue-green filters to separate the left and right projectors. A blue-green filter is placed over the source of light of the left projector and a red filter over the right projector. If the operator wears a pair of spectacles placing a blue-green filter over his left eye and red over the right eye, he will be able to see the stereomodel in three dimensions. Another variation of this system is called the SIA, or image alternator. This system does away with the glasses. Another system is called the PPV which uses polarizing filters instead of colored lenses. The optical train plotter creates a true three-dimensional model from which measurements are taken, by projecting the light rays optically through an optical train to a binocular for viewing.
Wild A-10 analog stereoplotter.
Photo By W. Mayo
Relative orientation is a process in which the two projectors are oriented so that diapositives have the exact relative angular orientation to each other in the projectors that the negatives had in the camera at the time of exposure.
Galileo Santoni model III analog stereoplotter.
Photo by W. Mayo
After relative orientation, the next step is the absolute orientation. This process involves scaling and leveling the model to given horizontal and vertical control. This description can be applied to the old Kelsh plotter.
Galileo Santoni model IV analog stereoplotter.
Photo by W. Mayo
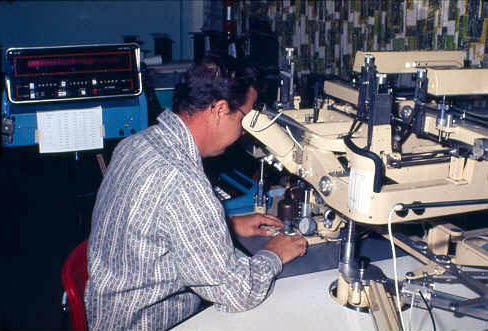
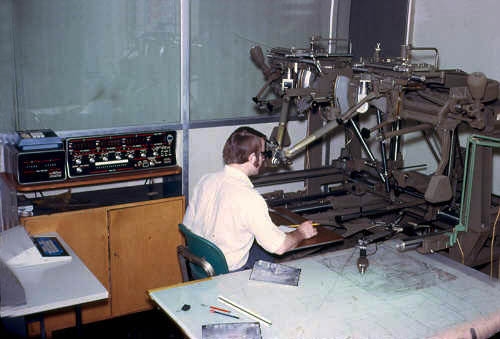
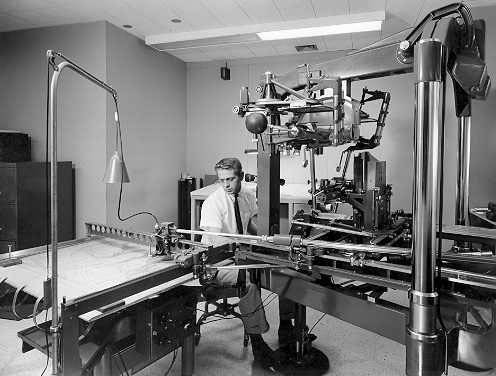
We have covered the projection plotter. The next plotter for discussion is the Analog Plotter. The analog plotter utilizes an optical train to view the image. Relative orientation is done manually using six basic projector motions : Kappa, Phi, Omega, X, Y, and Z. Kappa is swing, Phi is tip [ in line of flight] and Omega is tilt[ across the line of flight]. Like all stereoplotters it uses the floating mark principle to trace planimetric detail and to draw contours and make spot elevations. The vertical and horizontal information can be transmitted to the computer for storage. Movements from the plotter can be transmitted to the plotting table by means of a coordinatograph, pantograph, or electronically.
Full photo of the huge Wild A-10 analog stereoplotter. Note TV Camera mounted on coordinatograph.
Photo by W. Mayo
Although this type of machine is also aging and somewhat lacking in performance compared to the analytical plotter, many companies are still using them. Some examples of the old analog plotters are the Gallileo Santoni model III, IV, and V. These have been out of production for years and they continue with questionable capability. Others are the Kern PG-2, Wild B-8 and A-10. The A-10 with a good operator is still capable of producing a topographic map which will meet National Map Specs. It is only a matter of time and these also will go the way of the Kelsh plotter.
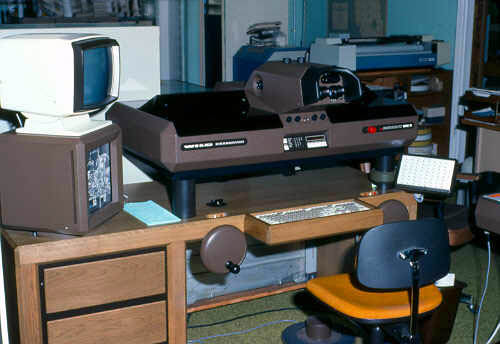
The Analytical Plotter
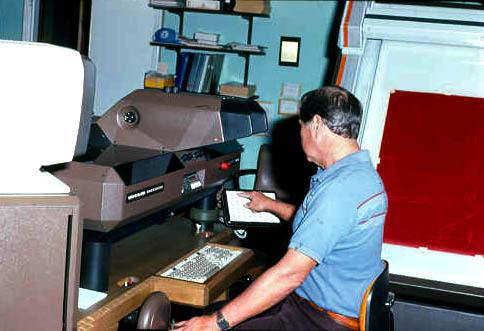
Wild BC-2 Analytical Plotter with automatic table.
Photo by W. Mayo
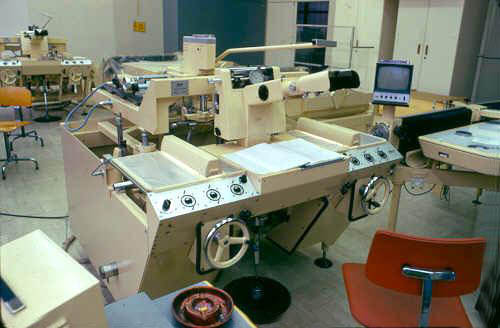
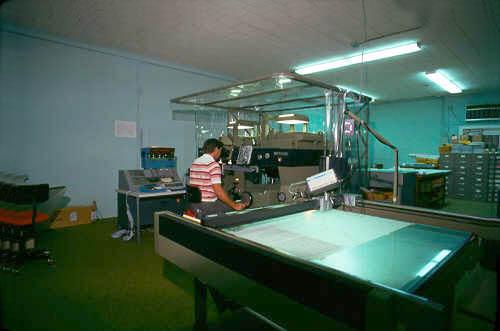
The introduction of the Analytical Stereoplotter was perhaps the greatest advance ever made in photogrammetry. Two companies produced the plotters, which made the old analog system completely obsolete. Wild-Heerbrug produced the BC-2 which was a real masterpiece. I had the pleasure of operating the BC-2 for over ten years. Zeiss produced the C-100, the P1 Intermap, and the P3 and P33 Planicomp configured with superimposition. The analytical plotter forms neither an optical nor projection image. Basically an analytical plotter is a stereocomparator which forms a mathematical model. A computer solves orientation elements and drives the coordinatograph for plotting. As mentioned previously volumes can be written describing the capabilities of the analytical plotter. It is difficult to mention only a few of these. There are numerous systems involved, all computer driven. One utilizes an automatic electronic plotting table. Movements in the stereoscopic model are transferred to the table, and recorded in a file in the computer. The automatic table performs a most important and varied task. The coordinatograph not only plots the movements from the plotter, since every movement is recorded in a file the computer controlled unit can replot any portion of the map at any scale. This makes the old hand method of scribing a thing of the past. The table can scribe any area at an incredibly fast speed. Obviously the capabilities of the automatic table are more than described here. Another method utilizes the superimposition of the contours over the model image in the plotter. Not only can the electronic table plot all information gathered in the computer, there are drum plotters which can also be used to quickly plot a finished product at any scale. Once you have used the analytical system it makes you wonder how you were ever able to accomplish anything using the old system.
Wild BC-2 Analytical Plotter.
Photo by W. Mayo
Very simply put, the stereoplotter is an instrument with which an operator can see a three dimensional image and by moving the microscopic black dot he can draw planimetric features and contours. Contours are lines of equal elevation, and by moving the "floating dot" and keeping it perfectly on the ground he can produce a contour. The area that can be compiled is called the neat model. Two successive negatives overlapping each other by 60 percent will produce stereoscopic coverage in the overlap area.
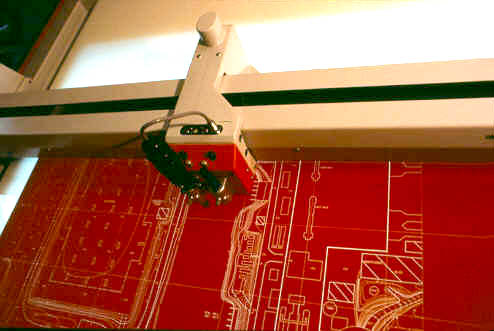
Automatic scribing with the automatic plotting table on the BC-2.
Photo by W. Mayo
VOLUMETRIC CALCULATION
The stereoplotter can be used to compute the actual volume of an area. Many different methods are used. One is to establish a base line and cross sections. By digitizing a series of computer generated spot elevations, we can calculate the area of each "slice" by using the average end area formula. As mentioned there are numerous methods and software programs which will compute the cubic yards of an area.

